
Chart Plotting in the Digital World
Published on November 11th, 2015
by Donald A. McLennan, SAIL magazine
When upgrading your boat’s electronics, you need to consider which electronic charts are available and supported by the various chartplotter manufacturers. The major multifunction displays from Garmin, Raymarine, Lowrance, Simrad, B&G and Furuno now support digital charts from several sources, including Raymarine, Jeppesen C-MAP, Lowrance, Fugawi, NV Charts, MapMedia, Navionics, Garmin and others. In many cases, this means users have choices regarding chart formats, data sources for specific regions, and enhanced features such as 3D and satellite views, tides and currents, custom sonar soundings, community edits and points-of-interest databases.
It is important to understand that commercial chart suppliers usually license chart data from authorized government hydrographic offices that also produce paper charts. The hydrographic offices of several countries, like the National Oceanic Atmospheric Administration (NOAA) in the United States, share their data freely and also give away electronic versions of their paper charts. NOAA, for instance, offers more than 1,000 U.S. raster and vector charts. Several chart manufacturers reformat government electronic charts to work on their hardware, and numerous PC and tablet charting programs can display NOAA chart files directly.
In selecting electronic charts, you should decide whether you prefer raster or vector charts, or if you want to use both. Raster charts are scanned images of paper charts and are familiar to most everyone. They are typically larger in file size and lack features like configurable depth units, on/off map information layers and other advanced functionality found in vector charts. The traditional look and feel of raster charts may also reassure those easing into electronic charts.
Vector charts are databases of chart objects (soundings, shorelines, navigational aids, etc.) that are assembled into a screen image on the fly by the chartplotter. Since a human cartographer is not involved in creating the image, they often lack the nuance of paper charts and can look quite plain. They are typically smaller in file size, so that more regional coverage can be provided on a single chip.
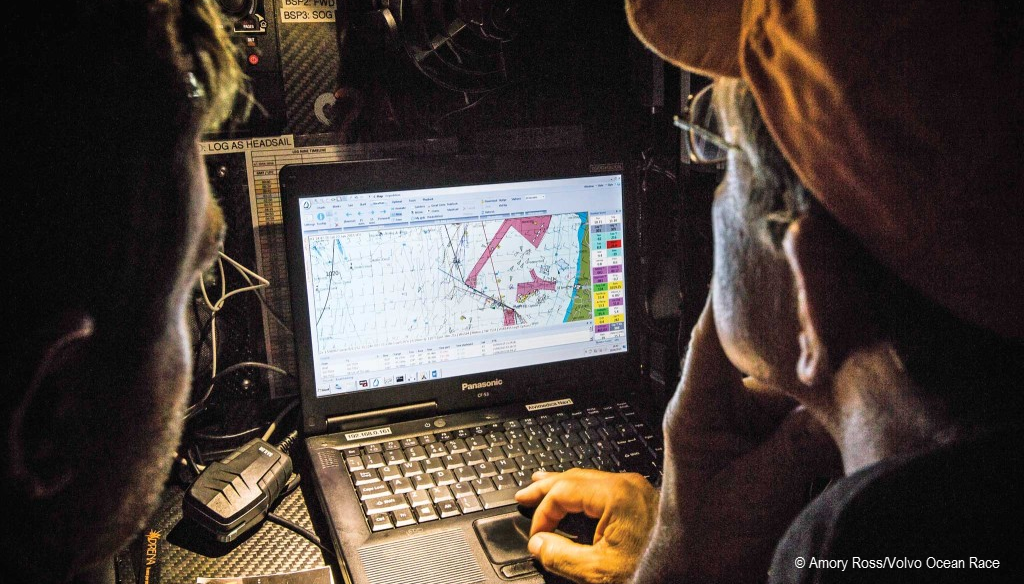
Furuno is just one of many companies that offer chartplotters with a wide range of functionality

While raster charts will occasionally and noticeably change scale as you zoom in and out, vector chart objects can change every time they’re zoomed. As a result, while a vector display can be less cluttered, you may have to zoom in quite far to see important details that are obvious on raster and paper charts. A vector chart can also look very precise when zoomed way in, but the user should understand that the detail is actually no more accurate than placing a magnifying glass on a paper chart.
Note that as an added benefit, vector charts are “smarter” than rasters in the sense that depth soundings can be turned right side up even if you’re using the chart “head up” while going south. Objects like navigational aids can also be queried for extra detail, and most chartplotters allow you to customize display colors, set safety-depth colors and contours, and display or hide objects by categories. – Full story

Related Posts

Marshall Cat takes on the Race to Alaska →
Gust and Lull Response →

Testing the scoring programs →
 We’ll keep your information safe.