How Data Can Help US Medal Count
Published on August 16th, 2016
by Allison McCann, FiveThiryEight
The U.S. sailing team left the 2012 London Olympics without any medals, it was the first time Americans had failed to place in an event since the 1936 Berlin games. They weren’t even that close, either. Sixteen sailors, across 10 events, and the best anyone managed at the 2012 London Olympics was fifth place. They were disappointed with the result, one that brought the failure of U.S. sailing, one of those sports we only really hear about every four years, to the forefront.
“It was really hard to watch, you could see it unfolding,” said Dean Brenner, the former chairman of U.S. Sailing’s Olympic Sailing Committee, about their performance in London. “And it was hard to deal with. It was was a very public stage, and we took our heat for it.” But Brenner was already on his way out after London, and the person taking over, Josh Adams, had four years to turn things around before sailing was back in the spotlight.
The first thing he did was get down to Rio.
Sailing is among the Olympic sports most influenced by environmental factors. “There’s quite a bit of randomness in our sport,” said Adams, the managing director of U.S. sailing. Despite the randomness, he said he knew that data acquisition would be paramount to the team’s success at the 2016 Olympics. “Rio de Janeiro was not a routine stop on the Olympic sailing circuit. There wasn’t an existing body of knowledge or data we could draw from, so as a team we had to start from scratch to learn about this venue,” he told me.

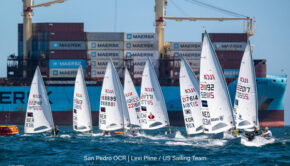
The geography of Guanabara Bay, the site of all of the 2016 sailing events, makes it one of the most unique and difficult sailing venues in the world. The large bay funnels out through a very small opening to the Atlantic Ocean, resulting in strong currents and erratic winds that whip around the 1,299-foot-tall Sugarloaf Mountain. And a lot can change from inside the bay, which is characterized by flat waters and a more complicated current, to outside the bay on the open ocean, where waves can reach 15 feet high.
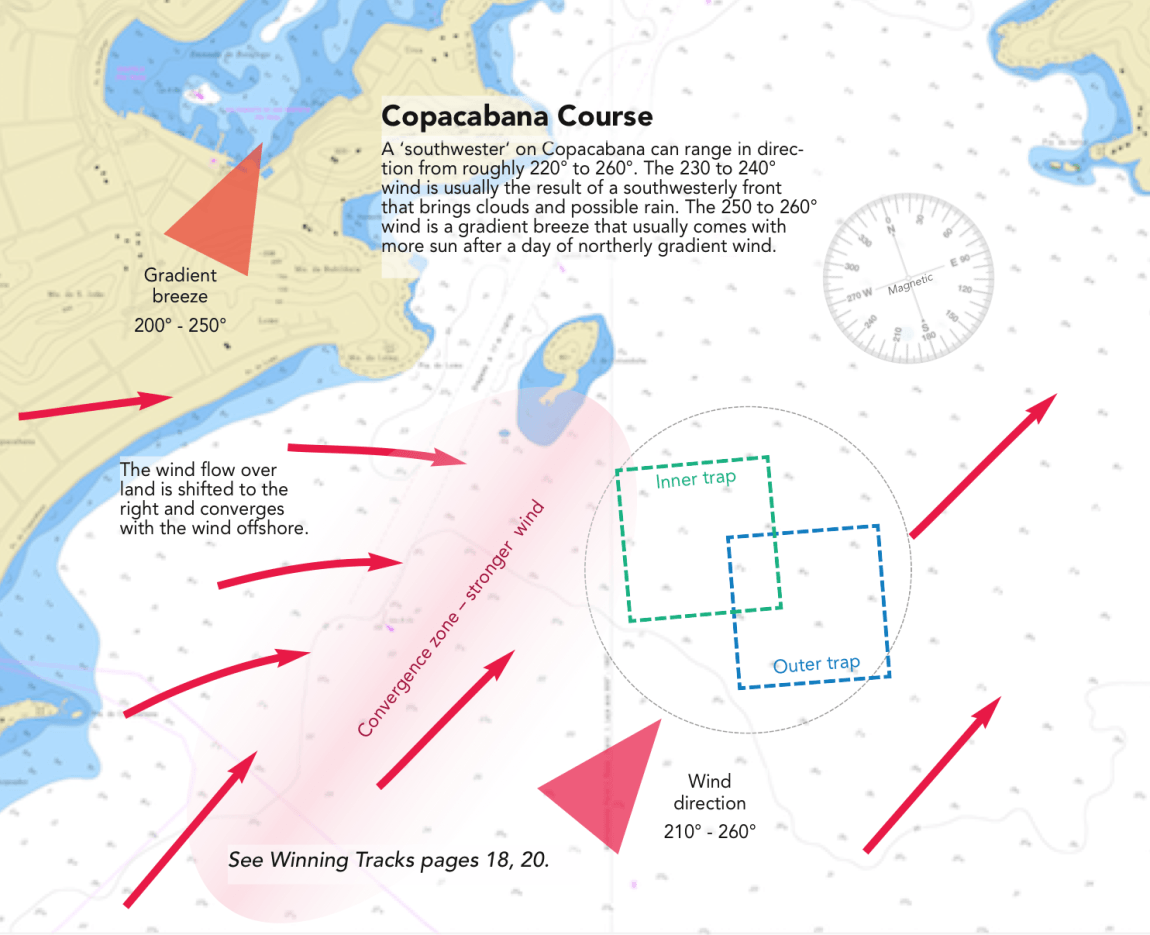
A page from the U.S. Sailing Team’s “Rio Weather Playbook”
So for the past three years, U.S. Sailing has been collecting data about Rio: about its currents, its winds, its tides, when the sun sets and where trash accumulates, any information that could potentially help the U.S. sailors better understand the complexities of Guanabara Bay and its seven race courses. While the exact location of courses on Guanabara weren’t finalized until the fall of 2015, test events in the two years prior gave Team USA a pretty good sense of where the races would be.
They dropped custom current buoys both inside and outside the bay, gathering data on how the water moves at various points throughout during the day. They tracked windspeed and direction, two factors that are critical to a sailor’s ability to find the fastest lane, and which can shift quickly around the mountains that flank both sides of the bay.
The three years of gathering and analyzing data culminated in what U.S. Sailing calls their “Rio Weather Playbook,” a body of critical information about each of the seven courses only available to the U.S. team. They’re not calling it a silver bullet, but Adams says the playbook project was one of the most comprehensive data efforts that U.S. sailing has ever done. “This is a unique undertaking for U.S. sailing,” he said. “In terms of the amount of time that we collected data, it’s one of the most extensive projects.” – Read On.

Related Posts
Thirty years later: Robert Scheidt →

Will Olympic sailing shift to the wing sail? →

America One Racing Performance Report →