Weather Radar: Reducing the Delay
Published on July 7th, 2016
Did you know that Doppler Weather Radar images from the National Weather Service (NWS) are not live? Scanning the atmosphere takes time and typically results in a delay of four to six minutes between image updates. When it comes to thunderstorms, a lot can happen in four to six minutes. In this report, meteorologist Mark Thornton describes how an upgrade to the NWS radar network is designed to refresh imagery more frequently…
Introduction
Doppler Weather Radar is your best defense against a hair-raising and wind-blown encounter with thunderstorms. The 155 stations in the National Weather Service’s (NWS) network provide overlapping, ground-based coverage of the nation’s inland and coastal boating areas. With an effective range of approximately 120 nautical miles, data from the NWS radar network is not accessible if you are well offshore. (Regardless of how you obtain your radar imagery, you are viewing NWS data as theirs is the only national radar network.)
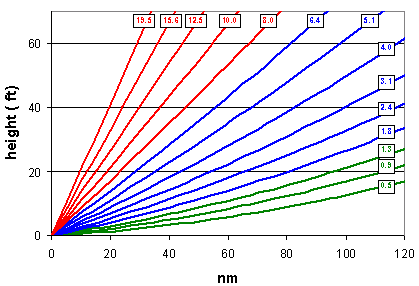
Figure 1: The NWS’s Volume Coverage Pattern (VCP) 12.
Scanning The Atmosphere
Strong thunderstorms may be several miles high, and so the radar station must collect data from the Earth’s surface up into the upper reaches of the atmosphere in order to completely analyze the storm. Stations use a variety of scanning strategies, called Volume Coverage Patterns (VCP) to accomplish this goal. The antenna makes an initial, or base, scan by making one complete revolution at an elevation of 0.5° above the Earth’s surface, alternating between emitting and collecting backscattered energy pulses. When this base scan is complete, the antenna completes additional scans, repeatedly increasing the elevation by about one degree, until the highest elevation of the VCP is reached. The highest elevation scanned by NWS radar is 19.5°.
Caution – Radar Images Are Not Live!
Executing the scans and collecting and processing the data for a VCP takes several minutes. For VCPs used during thunderstorm events, this can take from four to six minutes. As a result, radar images are not live, and may be anywhere from a few seconds to six minutes old. Fast-moving thunderstorms can travel six miles or more between updates, and therefore may be much closer than they appear on an outdated radar image. Comparing the image’s time stamp to the current time is critically important when thunderstorms are approaching.

In addition to covering a lot of ground, thunderstorms may significantly strengthen in the four to six minutes between image updates. For the forecasters at the NWS who are responsible for issuing severe weather warnings, the interval between updates is an extremely long time.

Figure 2: The NWS’s Volume Coverage Pattern (VCP) 12.
MESO-SAILS To The Rescue
MESO-SAILS (Multiple Elevation Scan Option-Supplemental Adaptive Intra-Volume Low-Level Scan) is currently being tested at several NWS radar stations. (Implementation of MESO-SAILS across the NWS radar network is expected by late 2016.) This software upgrade allows a NWS forecaster to modify the radar’s scanning strategy (VCP), and considerably shorten the time interval between base scans. This dramatic improvement is achieved by interrupting the normal progression of the VCP (increasing scan angles) and conducting an additional base scan. The traditional use of VCP 12 (Figure 2) takes approximately 253 seconds to complete and includes scans at 0.5, 0.9, 1.3, 1.8, 2.4, 3.1, 4.0, 5.1, 6.4, 8.0, 10.0, 12.5, 15.6, and 19.5 degrees.
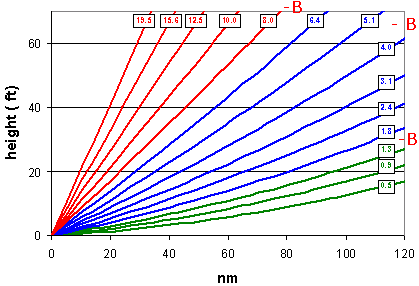
Figure 3: VCP 12 with additional base scans.
A version of VCP 12 using one of the MESO-SAILS options (Figure 3) includes three additional base scans. The additional base scans are inserted between the 1.3° and 1.8° scans, the 4.0° and 5.1° scans, and the 8.0° and 10.0° scans. While these three additional scans increase the total time of completing the VCP by 93 seconds (to 336 seconds), additional base scans are available every 70 to 90 seconds. Dramatically reducing the time between radar updates will prove advantageous to NWS forecasters trying to issue storm warnings, and to recreational boaters facing an approaching squall line.
MESO-SAILS In Action
As I was writing this article, a squall line swept across my home waters of Lake Erie at nearly 40 knots. NWS Cleveland is a MESO-SAILS test site and used the upgrade to monitor the approach and evolution of the system. The SAILS label in the lower right corner of my radar application (Figure 4) let me know that MESO-SAILS was in use and that I would benefit from more timely radar data. Getting a fresh look at the system every 90 seconds was a big advantage.
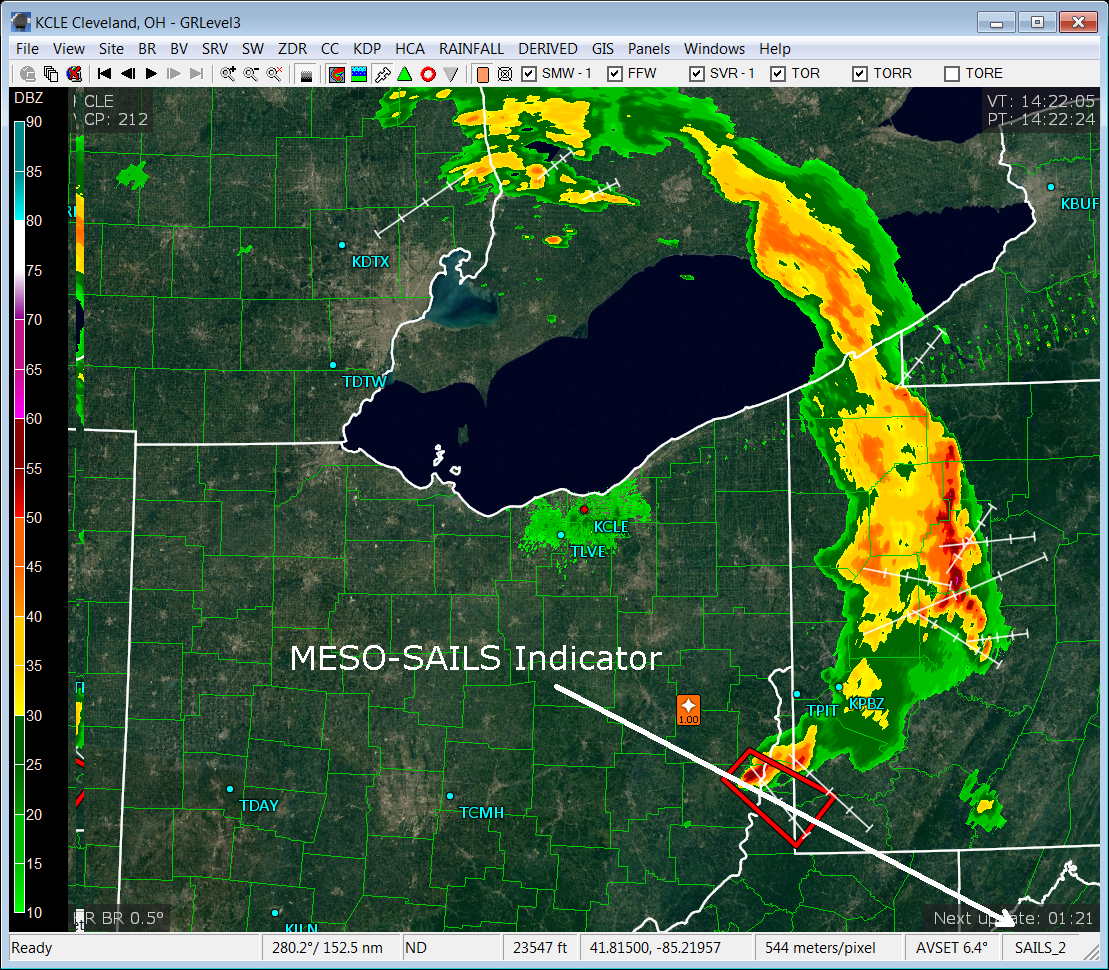
Figure 4: NWS radar image showing MESO-SAILS.
Source: Mark Thornton, LakeErieWX: Marine Weather Education and Forecasting Resources

Related Posts
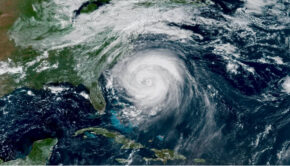
Good news for Atlantic hurricane season →
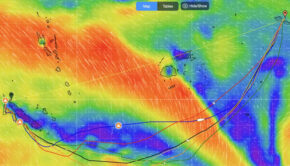
Offshore racing routing software in 2026 →
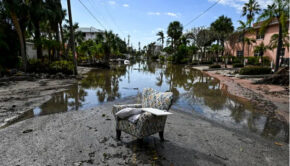
Three places overdue for hurricane →