Doppler Weather Radar: A Boater’s Best Friend
Published on July 24th, 2017
by Mark Thornton, LakeErieWX
Weather-savvy mariners know the best resource for monitoring the location, size, intensity, and movement of thunderstorms is Doppler Weather Radar from the National Weather Service (NWS). In the first of a two-part series, I’ll explain the basics of radar and introduce the most common types of imagery.
Figure 1: The National Weather Service Doppler Weather Radar network. (Click image for a larger version.)
The Network
The NWS’s Doppler Weather Radar network is comprised of 159 ground-based stations (figure 1). These stations are strategically placed to protect major population centers and to cover for adjoining stations during an outage or when maintenance is required.
There are many websites and smartphone/tablet applications that provide access to radar imagery. Since the NWS operates the only national network, regardless of how you obtain radar imagery, you are viewing NWS data.
The Basics
Strong thunderstorms may reach a height of 50,000 feet. To assess their overall structure, the radar station employs several scanning strategies, called Volume Coverage Patterns (VCP), to collect data from the surface to the upper reaches of the atmosphere.

The antennae makes an initial, or base, scan by making one complete revolution at an elevation of 0.5° above the Earth’s surface. When this base scan is complete, the antennae completes additional scans, repeatedly increasing the antennae’s elevation by about one degree until the highest elevation of the VCP is reached. The highest elevation scanned by NWS radar is 19.5°. The collection of individual scans within a VCP is known as a volume scan (figure 2).
Figure 2: NWS sample Volume Coverage Pattern (VCP). (Click image for a larger version.)
As the station’s antennae spins, it emits short bursts of energy pulses (at a wavelength of 10.7 cm) that travel radially (like spokes on a wheel) away from the station at nearly the speed of light (figure 2). If these pulses encounter a target, such as a raindrop, hailstone, bird, insect, or other object, a portion of the energy is backscattered (reflected back) toward the station along the same radial travelled on the outbound journey (figure 3).
Although pulses are sent nearly 1,300 times a second, the station spends the majority of the time listening and extracting data from backscattered energy pulses.
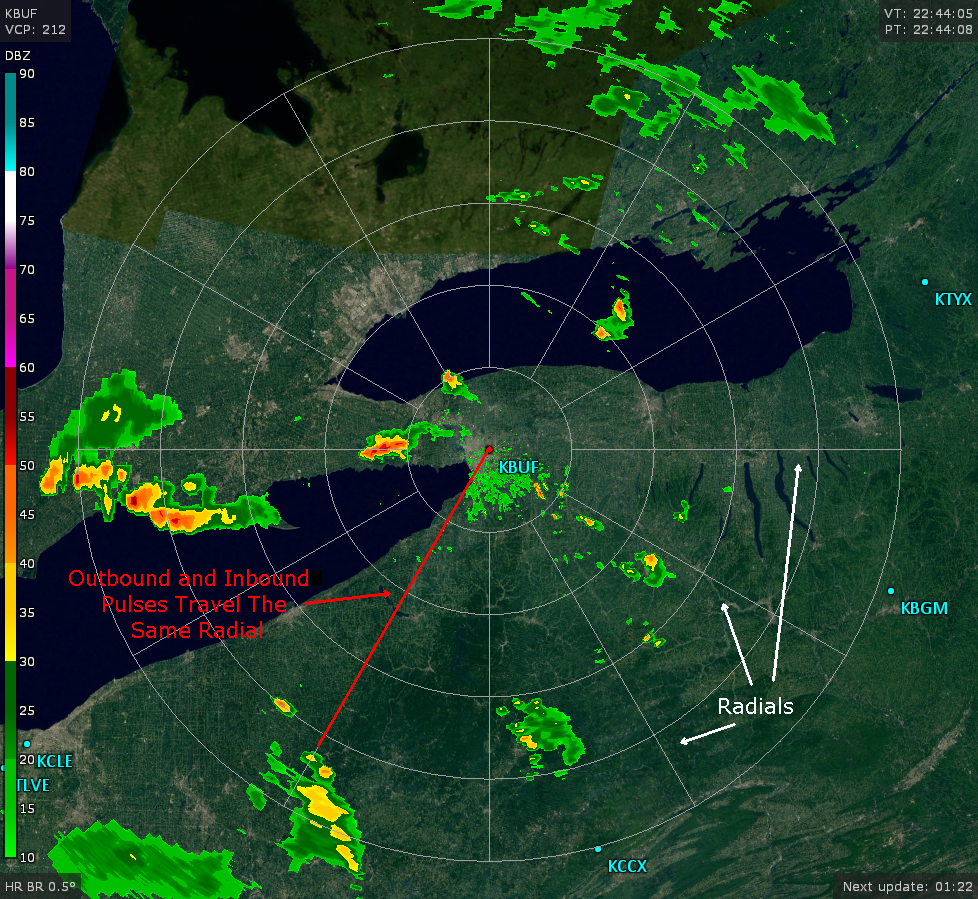
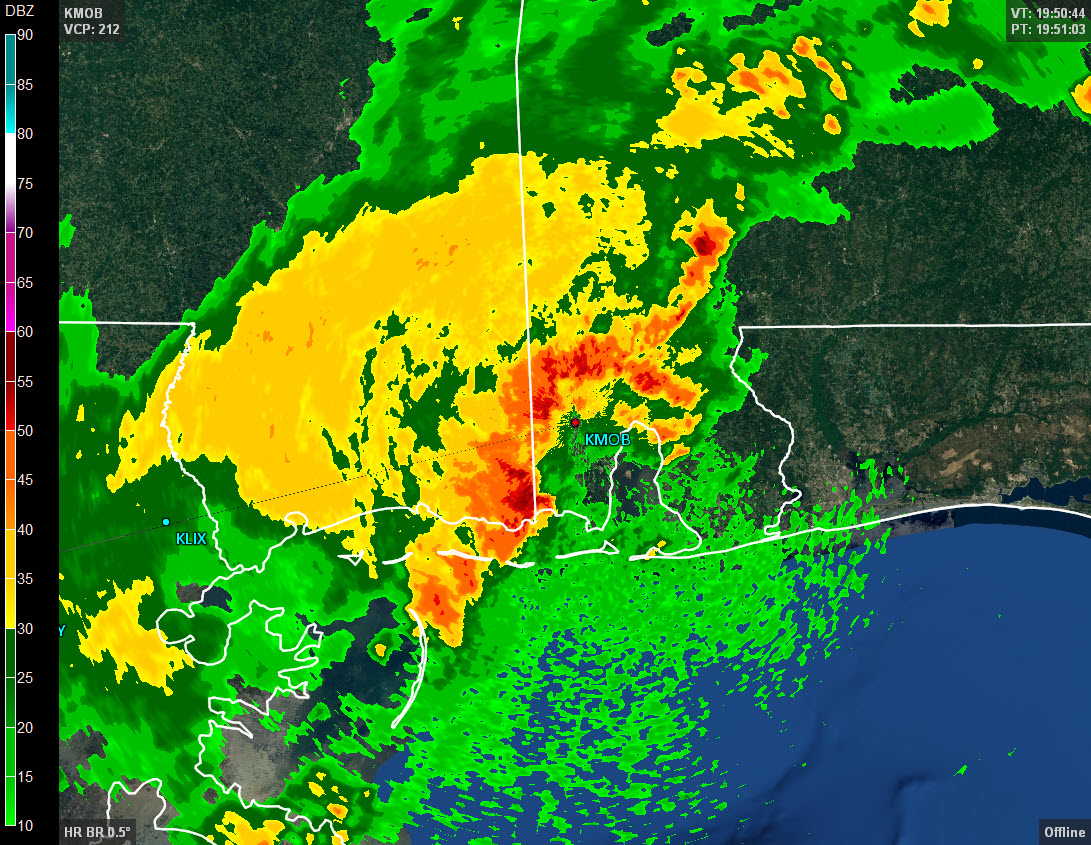
Figure 3: Base reflectivity image from KBUF (Buffalo, New York) with range rings and radials. (Click image for a larger version.)
A wealth of useful information is derived from the backscattered pulses, such as the target’s direction and distance from the station, its height above the ground, its shape, and other physical characteristics. (Upgrades over the past few years have improved the system’s ability to discern between dust, insects, raindrops, etc.)
While the wavelength of the backscattered pulse doesn’t change as it travels through the atmosphere, its frequency shifts based on its motion relative to the radar station. By detecting this change in frequency – the Doppler Shift — the station can determine if the object is moving toward or away from the station, and the speed at which it is moving.
Let’s take a look at the two most common types of radar imagery….click here.

Related Posts

New education initiative by World Sailing →

Same Sh*t, Different Day →

Shift into comeback mode →

 We’ll keep your information safe.