
Regatta attendance data analysis
Published on June 10th, 2026
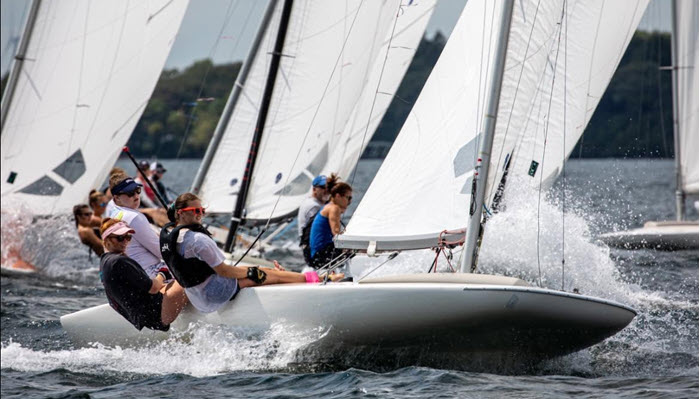
The 20-foot C Scow is actively raced in the inland lakes of the USA from Iowa to Michigan, and the National C Scow Sailing Association (NCSSA) wants to keep it that way. Here is what they are doing about it:
One of our objectives as a Board is to use data to get a better understanding of the health of our fleet. We are thinking of health both in terms of “boats registered for lake/home races” and “regatta attendance”. This will help us separate fact from fiction and enable us to pursue targeted actions to address what’s working / not working.
The first thing we’ve done is review regatta attendance over the last ~8 years to identify trends (see our findings below).
The Core Problem: Fewer Regattas Per Sailor
The fleet isn’t shrinking; there are roughly the same number of C Scow sailors as before, but they’re simply not attending as many regattas. In 2018, we had 185 unique skippers combining for 480 regatta entries versus 177 skippers and 358 entries in 2025. 2025 hit an all-time low of only 40 boats attending 3+ regattas, and regattas per skipper dropped to 2.02, the lowest in the 8-year sample (down from 2.59 in 2018).

Most of the Attendance Drop is in Big Regattas
Spring and Fall regatta participation has been roughly constant, meaning the largest Summer regattas are where participation dropped most (Nationals, ILYA, etc.).
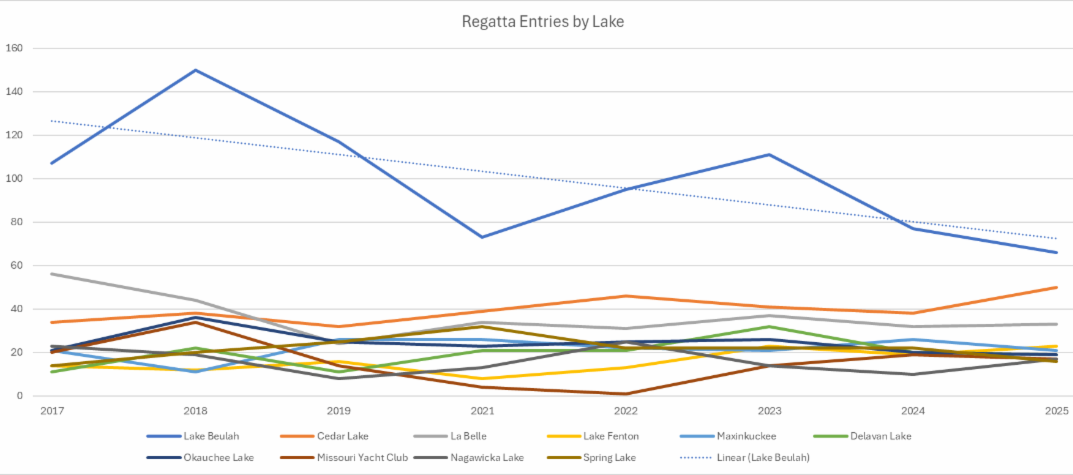
Lake Beulah’s Attendance Dropping is a Larger Driver
In 2025, Beulah (East Troy, WI) logged 35 fewer total entries than their median and 84 fewer than their peak. Their entries-per-boat dropped to 2.5 (vs. a high of 4.1 in 2018). Historically, no other lake has topped 50 total entries, meaning Beulah’s engagement essentially sets the ceiling for the whole fleet.
Attendance is Cyclical
We tend to get more registrations when major regattas are held in Wisconsin, where we’ve historically drawn the bulk of regatta attendees. The NCSSA controls the Nationals event, where we try to alternate the host club on a four-year cycle, to maximize regatta attendance while also ensuring fleet growth outside of the “core”. This rotation generally looks like: Wisconsin -> “East” venue-> Wisconsin -> “West” venue.
Junior Participation
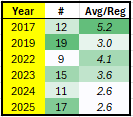 The data to the right shows the number of juniors attending Nationals as well as the average number of total regattas they attended over the full season. The takeaway is that we have a healthy, consistent number of unique junior sailors but, similar to our overall fleet, they are sailing fewer regattas overall.
As a next step we will build an action plan to engage the fleet to attend more regattas. We would love your feedback as we develop these plans so please reach out to any NCSSA board rep if you have thoughts!
Note: Big shout-out to our very own data nerd and board member, Andrew Bohl, for running this analysis!

Related Posts

Is this the future of sailing? →

People that go above and beyond →

Sailing is changing… do you like it? →